When we run social media ads for our clients, they often ask us about industry benchmarks. It’s an understandable curiosity. After all, when a company puts out paid social content, they should know how their ads are stacking up against their competitors and industry averages.
So, we scoured the internet to find industry-specific data for 5 social media platforms:
- Facebook Social Advertising Benchmarks.
- LinkedIn Social Advertising Benchmarks.
- YouTube Social Advertising Benchmarks.
- Instagram Social Advertising Benchmarks.
- Twitter Social Advertising Benchmarks.

What Social Media Metrics Are We Talking About?
Our focus here is on social advertising metrics — not organic performance metrics. So, we’re looking specifically at things like engagement with paid ads and sponsored posts on each platform.
The KPIs we’re covering vary slightly per platform, partly due to how users engage with ads across platforms, and partly due to differences in the data that’s been published for each industry and app. In general, though, we’re diving into several key metrics including:
- Click-through rate (CTR).
- Cost per click (CPC).
- Cost per mille (CPM).
- Cost per conversion.
As for which industries are taking the spotlight, these vary as well. In each source of data we looked at, business categories are packaged a little differently. But it makes sense: The industries sponsoring content on platforms like Facebook tend to lean more into the lifestyle and B2C space. Meanwhile, the breakdown of industries advertising on LinkedIn falls further on the professional, B2B side.
Of course, there is plenty of crossover. It just means you might see your own business overlapping in several different industries — from “Software and Internet” to “Business and Finance.”
Either way, whatever industry you’re in, and whatever platform you advertise on, you’ll find some useful references throughout this roundup-style resource.
Facebook Ad Benchmarks
Facebook is an increasingly versatile social media platform, offering users dozens of ways to engage with friends, family members, interest groups, local businesses, global brands, news outlets and more.
Not surprisingly, the app supports a wide range of sponsored content types. Facebook ad formats include:
- Photos with captions.
- Videos.
- Linked carousel content.
- Stories.
- Messenger ads.
- Product collections.
- Interactive games.
The type of format you choose for your business will depend on what product or service you’re promoting, but there’s no limit to the ways you can showcase your offerings.
How do your ads stack up against those of your industry peers? Let’s find out.
Subscribe to
The Content Marketer
Get weekly insights, advice and opinions about all things digital marketing.
Thank you for subscribing to The Content Marketer!
Facebook Ad Click-Through Rate by Industry
It’s great when people see your ad, but it’s even better when they click on it and spend time exploring what you’re promoting. As a social ad benchmark, CTR helps illuminate how you’re doing on that front.
Click-through rate describes the percentage of ad viewers who click on your advertisement. The basic formula is:
Number of Ad Clicks ÷ Number of Ad Impressions x 100 = Click-Through Rate (%)
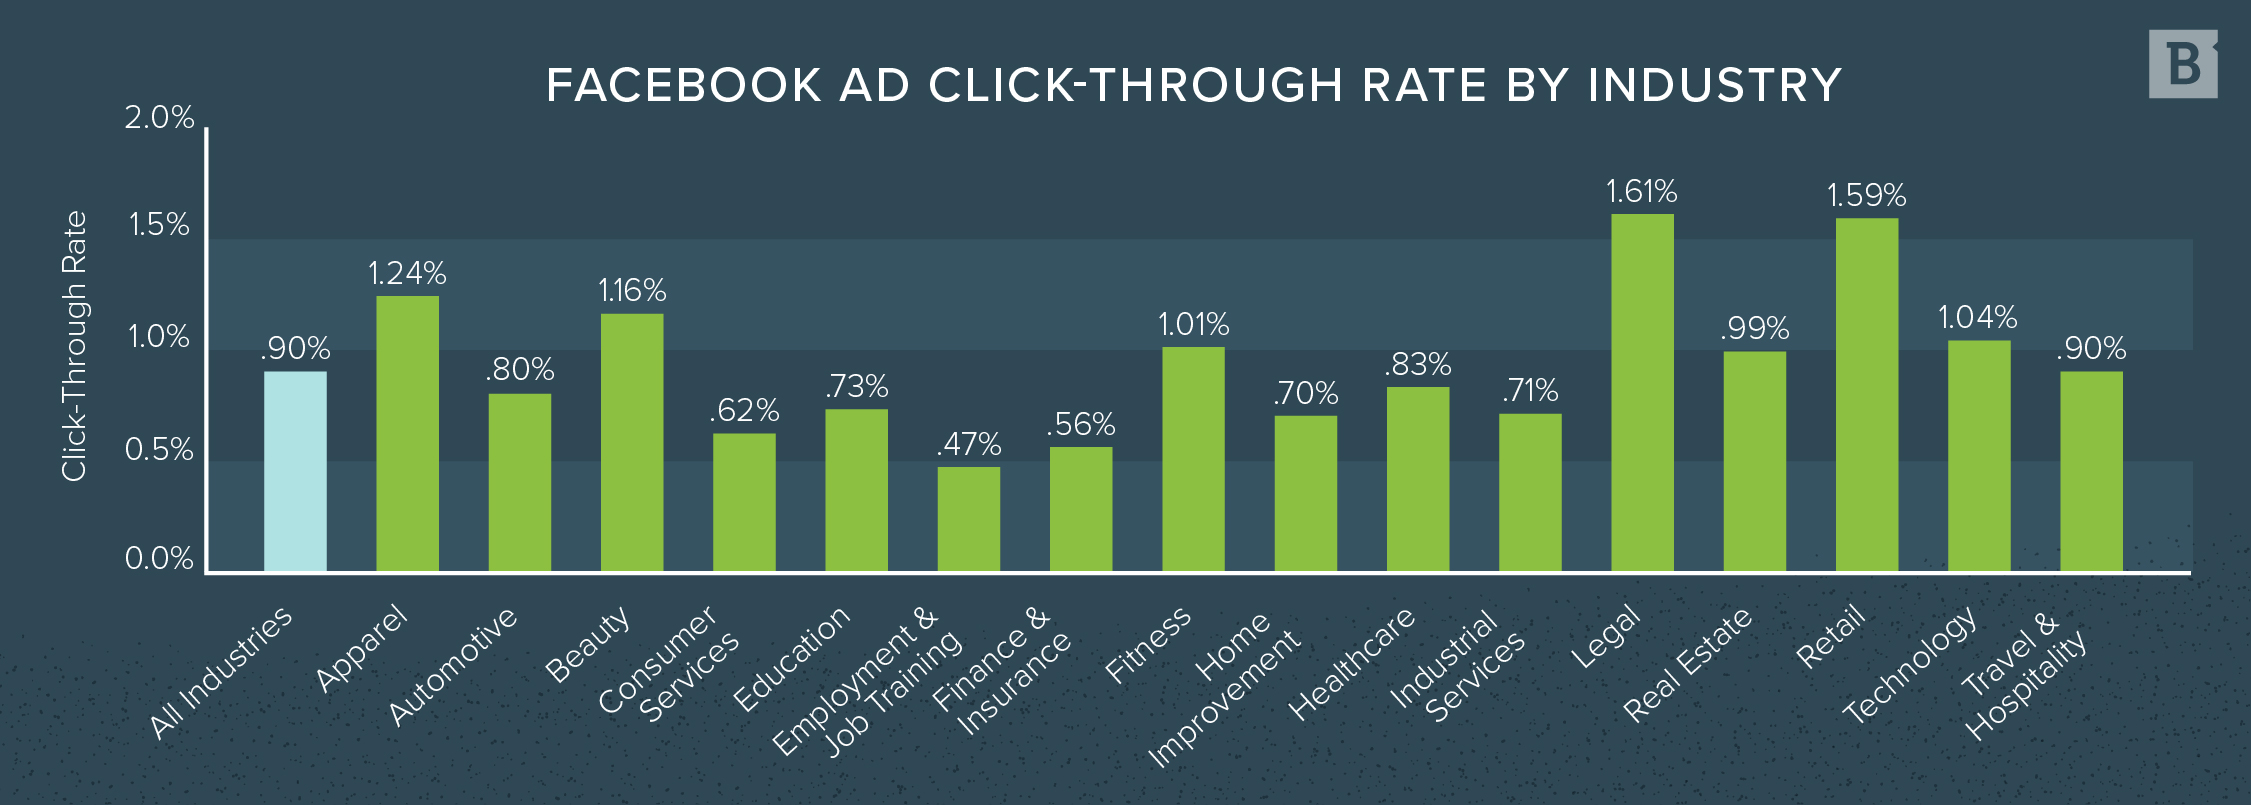
On Facebook, the average CTR across all industries is 0.90%. This means one person will click on a Facebook ad for roughly every 110 impressions it gets, on average.
Legal and retail are neck-and-neck with the two highest CTRs, hovering around 1.6%. This suggests businesses in these verticals tend to get one click for every 60 or so impressions.
Meanwhile, the employment and job training sector sees the lowest response at 0.47% — or slightly less than one click for every 200 impressions.
To explore more about how different ads are performing and gain insights, you can use the Facebook Ads Library, a comprehensive resource that allows you to view ads currently running on Facebook. This tool can help you understand what works best in your industry and potentially improve your own ad performance.
Source: Wordstream
Facebook Ad Cost per Click by Industry
If click-through rate expresses how much exposure your ad needs to get before it gets clicked on, cost per click shows you how much it costs you to get that all-important click.
Here’s how CPC is calculated:
Total Ad Spend ÷ Number of Ad Clicks = Cost per Click ($)
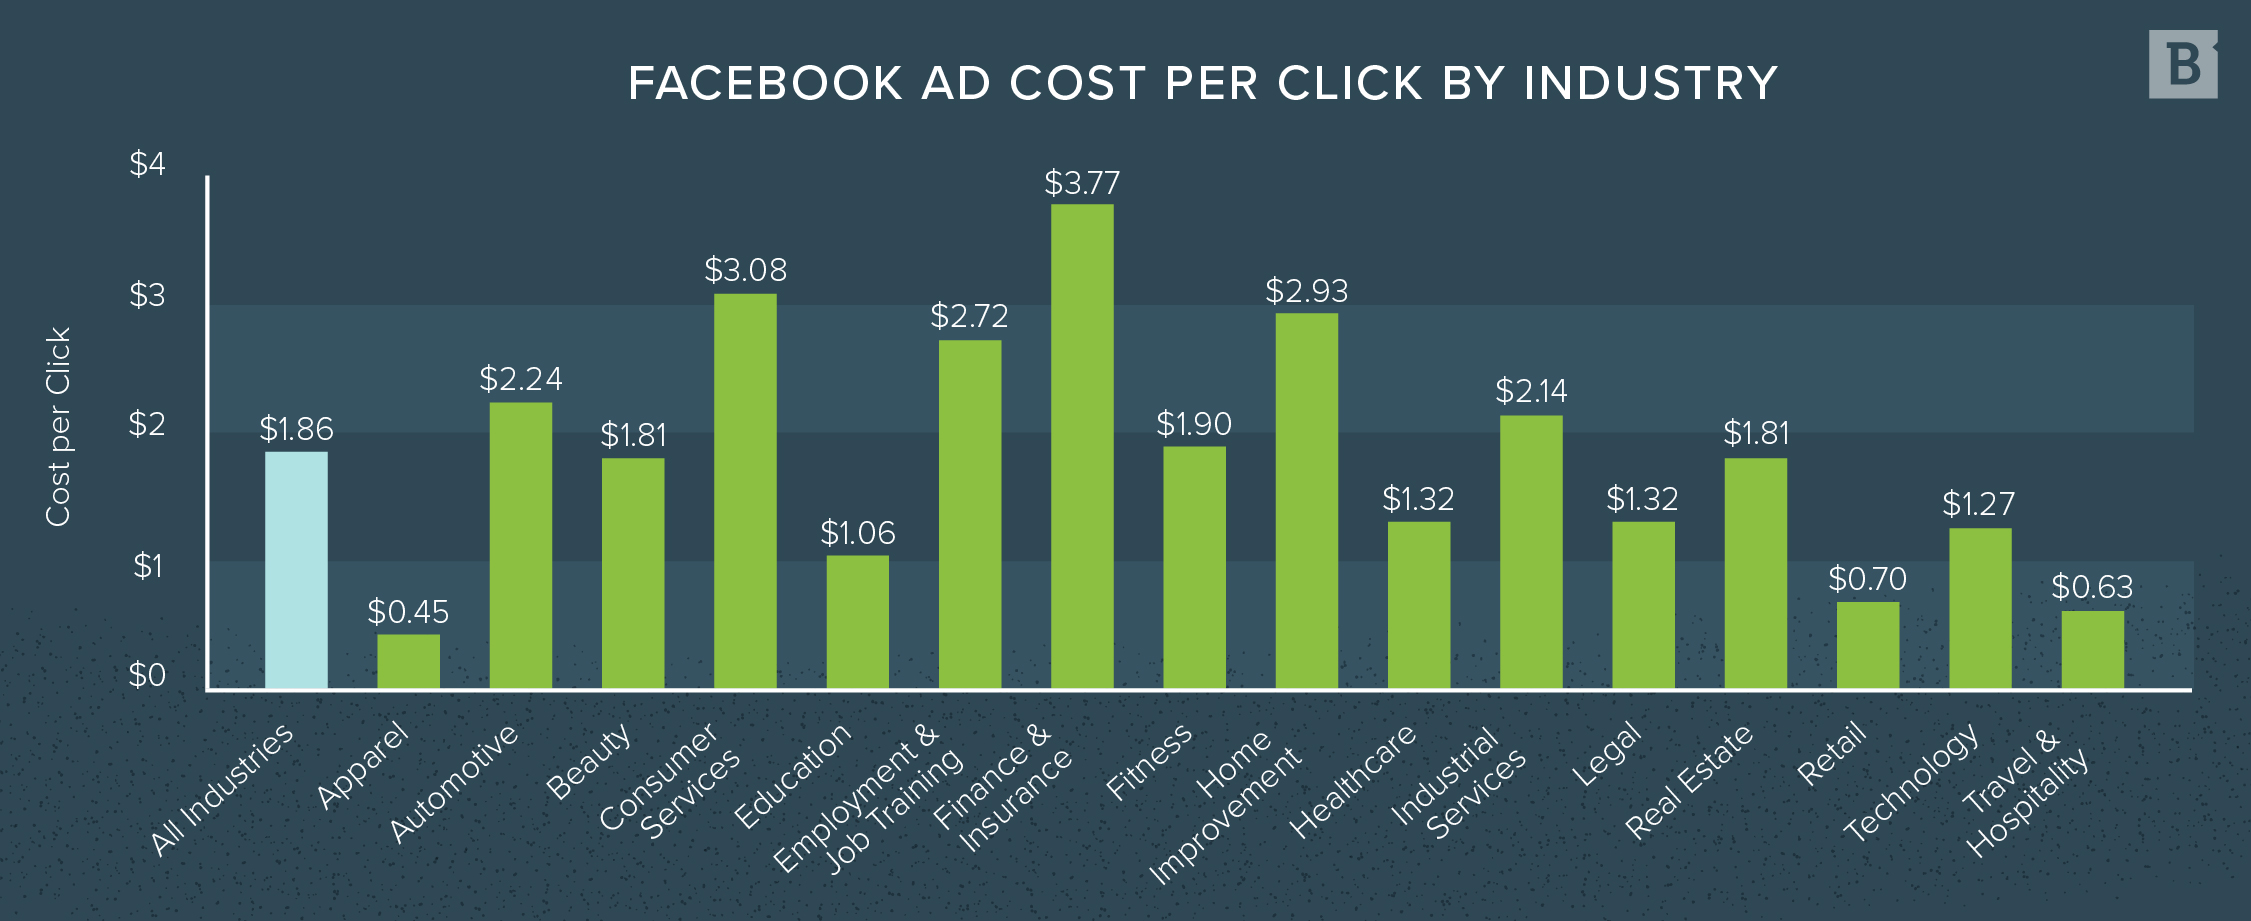
So, if you spent $2,000 in a given month and got 1,075 clicks, your CPC would be $1.86. And that would be spot-on for the cost-per-click benchmark across all industries that advertise on Facebook.
The finance and insurance vertical has the highest CPC at $3.77, while the apparel industry has a significantly cheaper benchmark at just $0.45. Retail and the travel and hospitality space also have CPCs below $1.00.
Source: Wordstream
Facebook Advertising Conversion Rate by Industry
After someone clicks on your ad, the hope is that they’ll take your desired action. The specific type of conversion will vary depending on your offering and your industry — it might be a purchase or a white paper download, or something else entirely. Either way, it’s useful to understand what percentage of your overall ad clicks are generating results.
This isn’t always the easiest thing for Facebook to calculate based on the available data, so the platform sometimes uses statistical modeling to estimate click conversion rates. But here’s a basic formula you can use to determine your own ad performance:
Number of Ad Conversions ÷ Number of Ad Clicks x 100 = Conversion Rate (%)
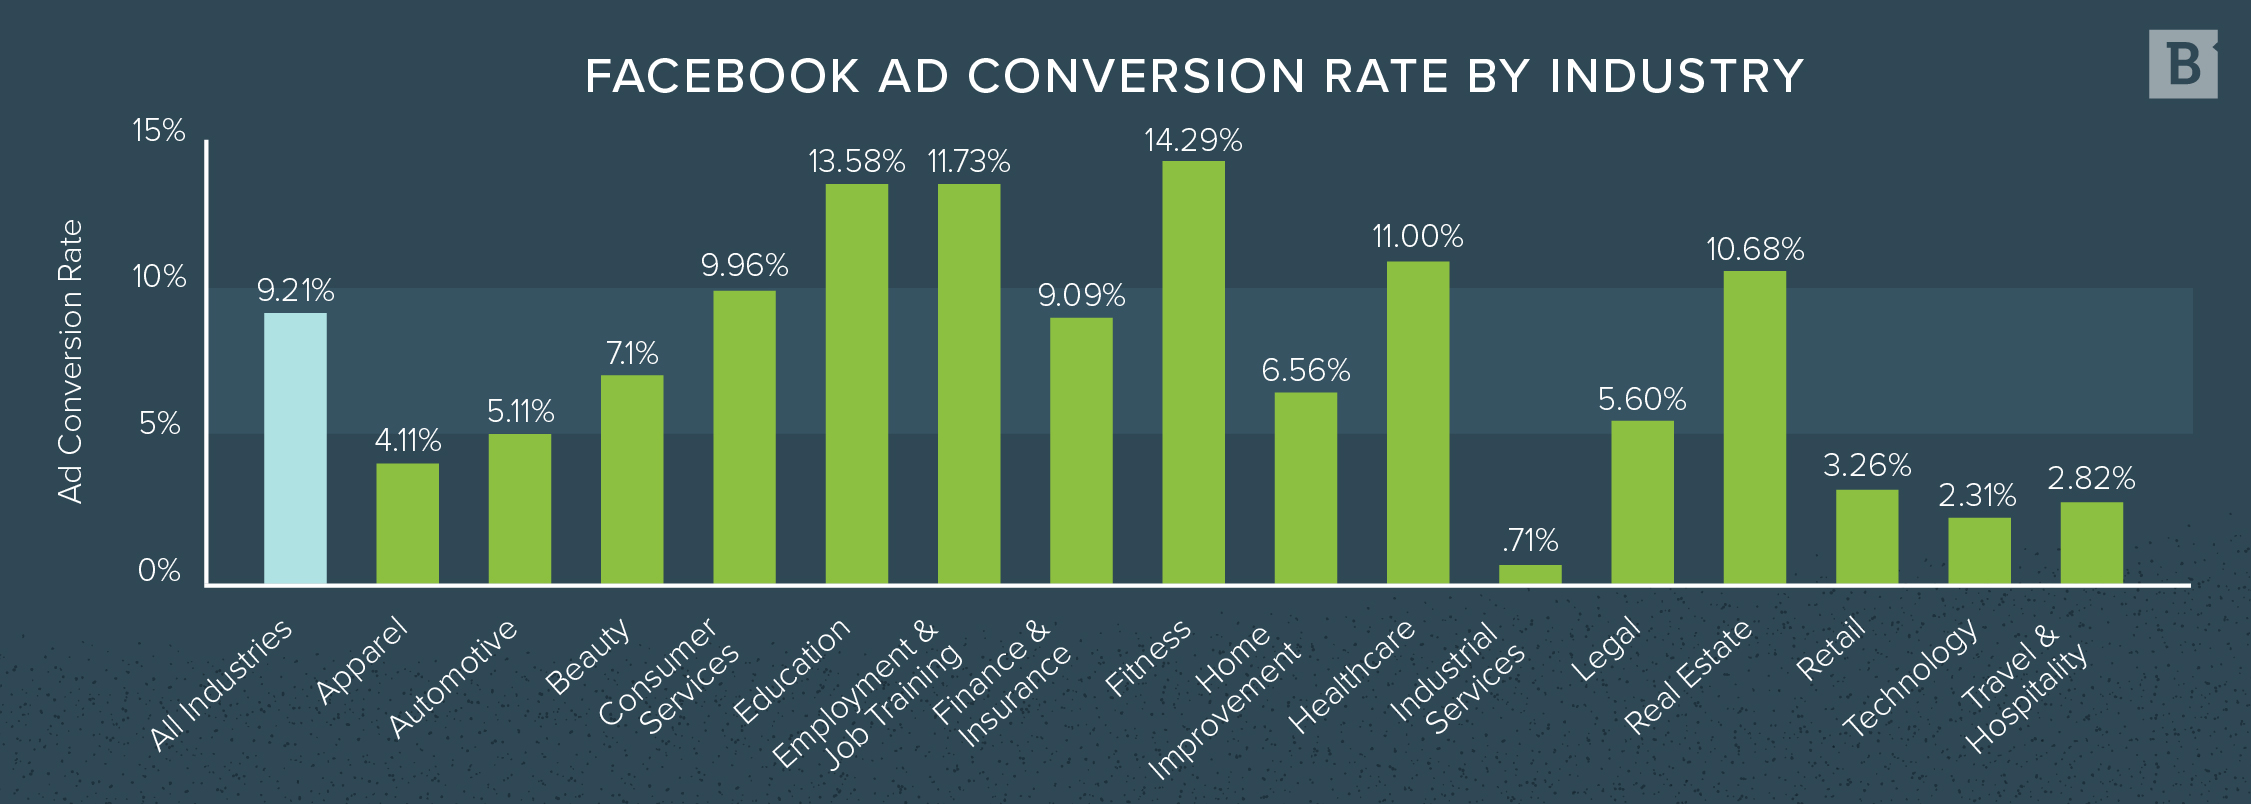
The benchmark across industries is 9.21%, meaning for every 100 clicks an ad gets, roughly 9 people will convert.
Industry-specific averages vary widely, however, with industrial services sitting at just 0.71% and fitness up at 14.29%. When it comes to conversion rates, the higher the percentage, the better — but a lower rate may actually be on par for your particular vertical.
Source: Wordstream
Facebook Advertising Cost per Action by Industry
As Facebook explains it, “Cost per action (CPA) allows you to pay only for actions people take because of your ad. This is useful if you want to control how much you pay for specific actions.
For example, you can use CPA to monitor how much you pay on average for link clicks instead of impressions.”
In other words, you can opt to pay only when a Facebook user interacts with your ad in the desired manner, instead of paying whenever you get eyeballs on your ad. But you’ll pay a higher rate for this more targeted approach.
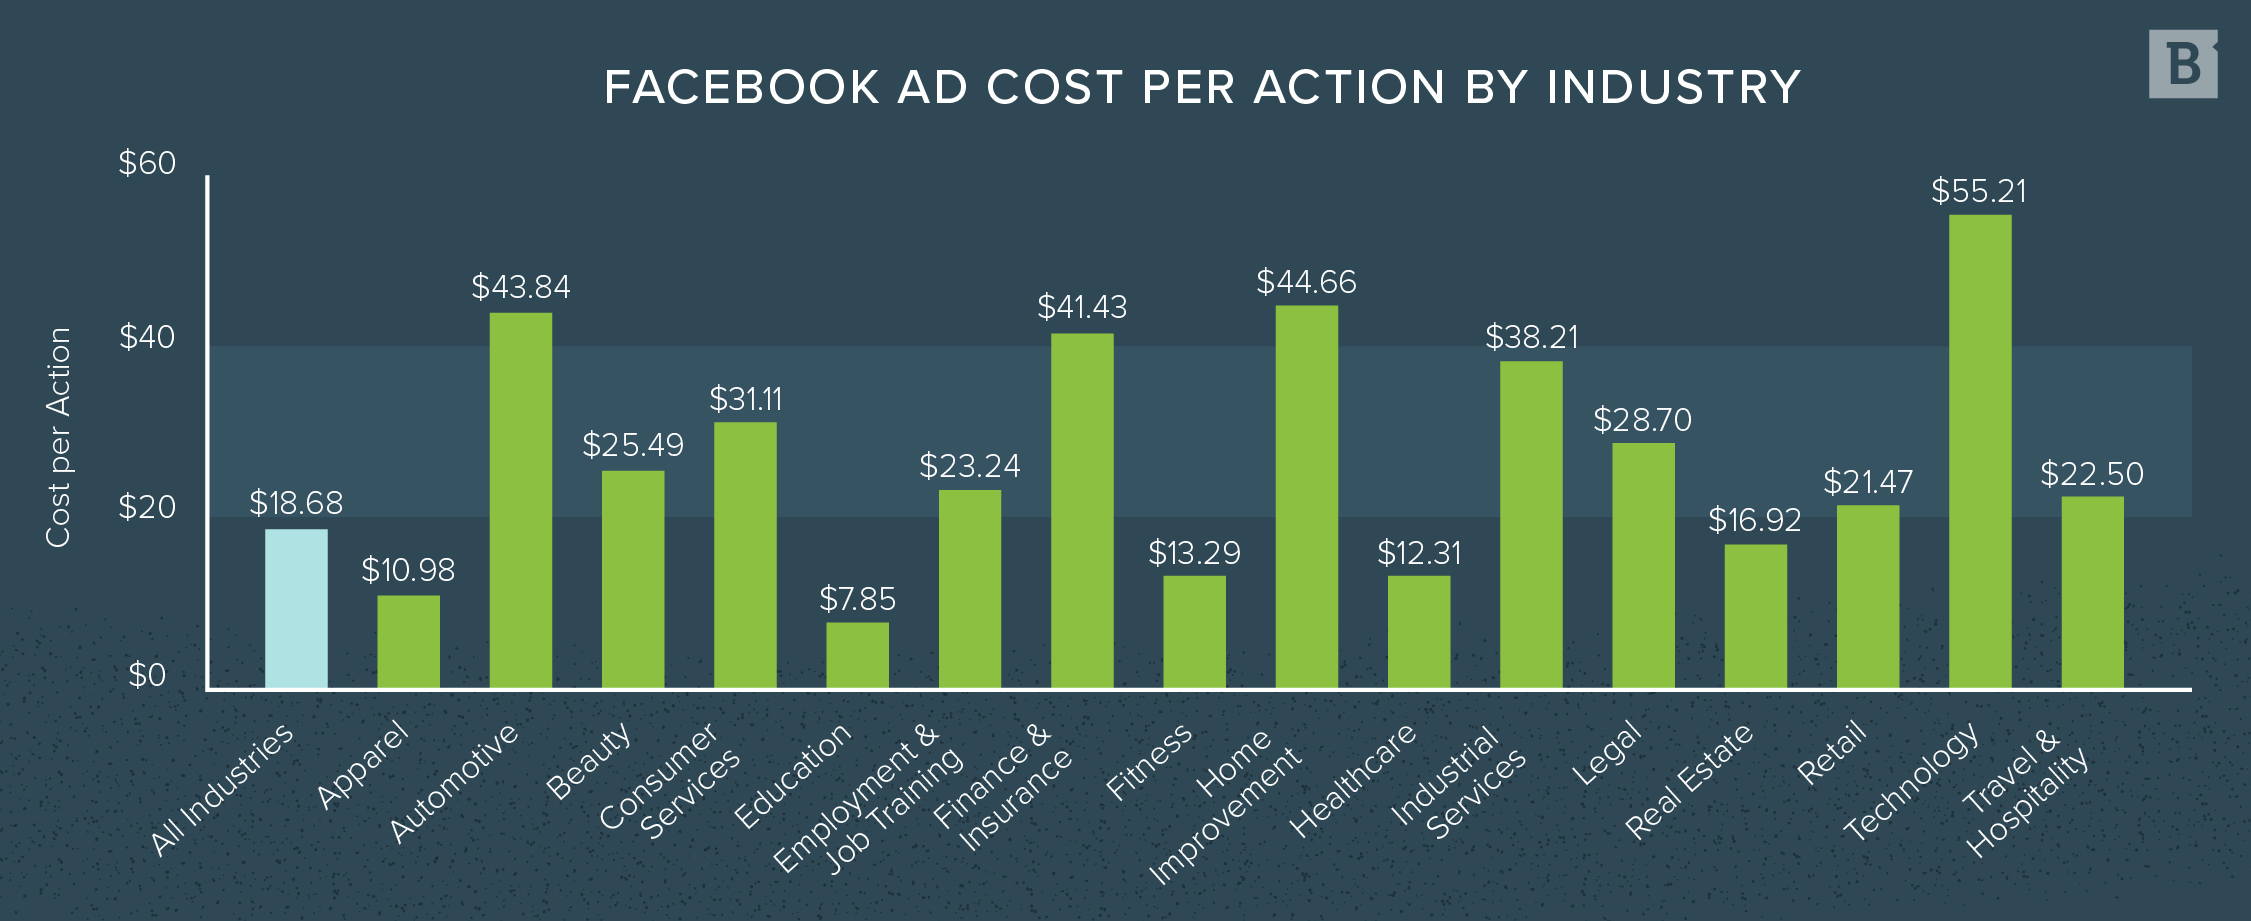
Across industries, the average CPA is $18.68. Education has the lowest rate at $7.85, while technology exceeds all other industries at a cost of $55.21 per action.
Several verticals fall between $21 and $32, including retail, travel and hospitality, employment and job training, beauty, legal and consumer services. For a CPA between $41 and $44, there are the finance and insurance, auto and home improvement industries.
Source: Wordstream
LinkedIn Advertising Benchmarks
With more than 750 million members from across the business world, LinkedIn is the platform of choice for advertisers looking to target decision-makers and busy professionals.
Sponsored content options on LinkedIn include:
- Posts.
- Direct messages.
- Job listings.
- Sidebar ads.
- Dynamic ads.
Some allow advertisers to directly target — and even directly engage with — target users on the platform, while others are more traditional in nature.
However your business uses LinkedIn advertising, here’s a helpful overview of ad benchmarks across a dozen different industries:
LinkedIn Ad Click-Through Rate by Industry
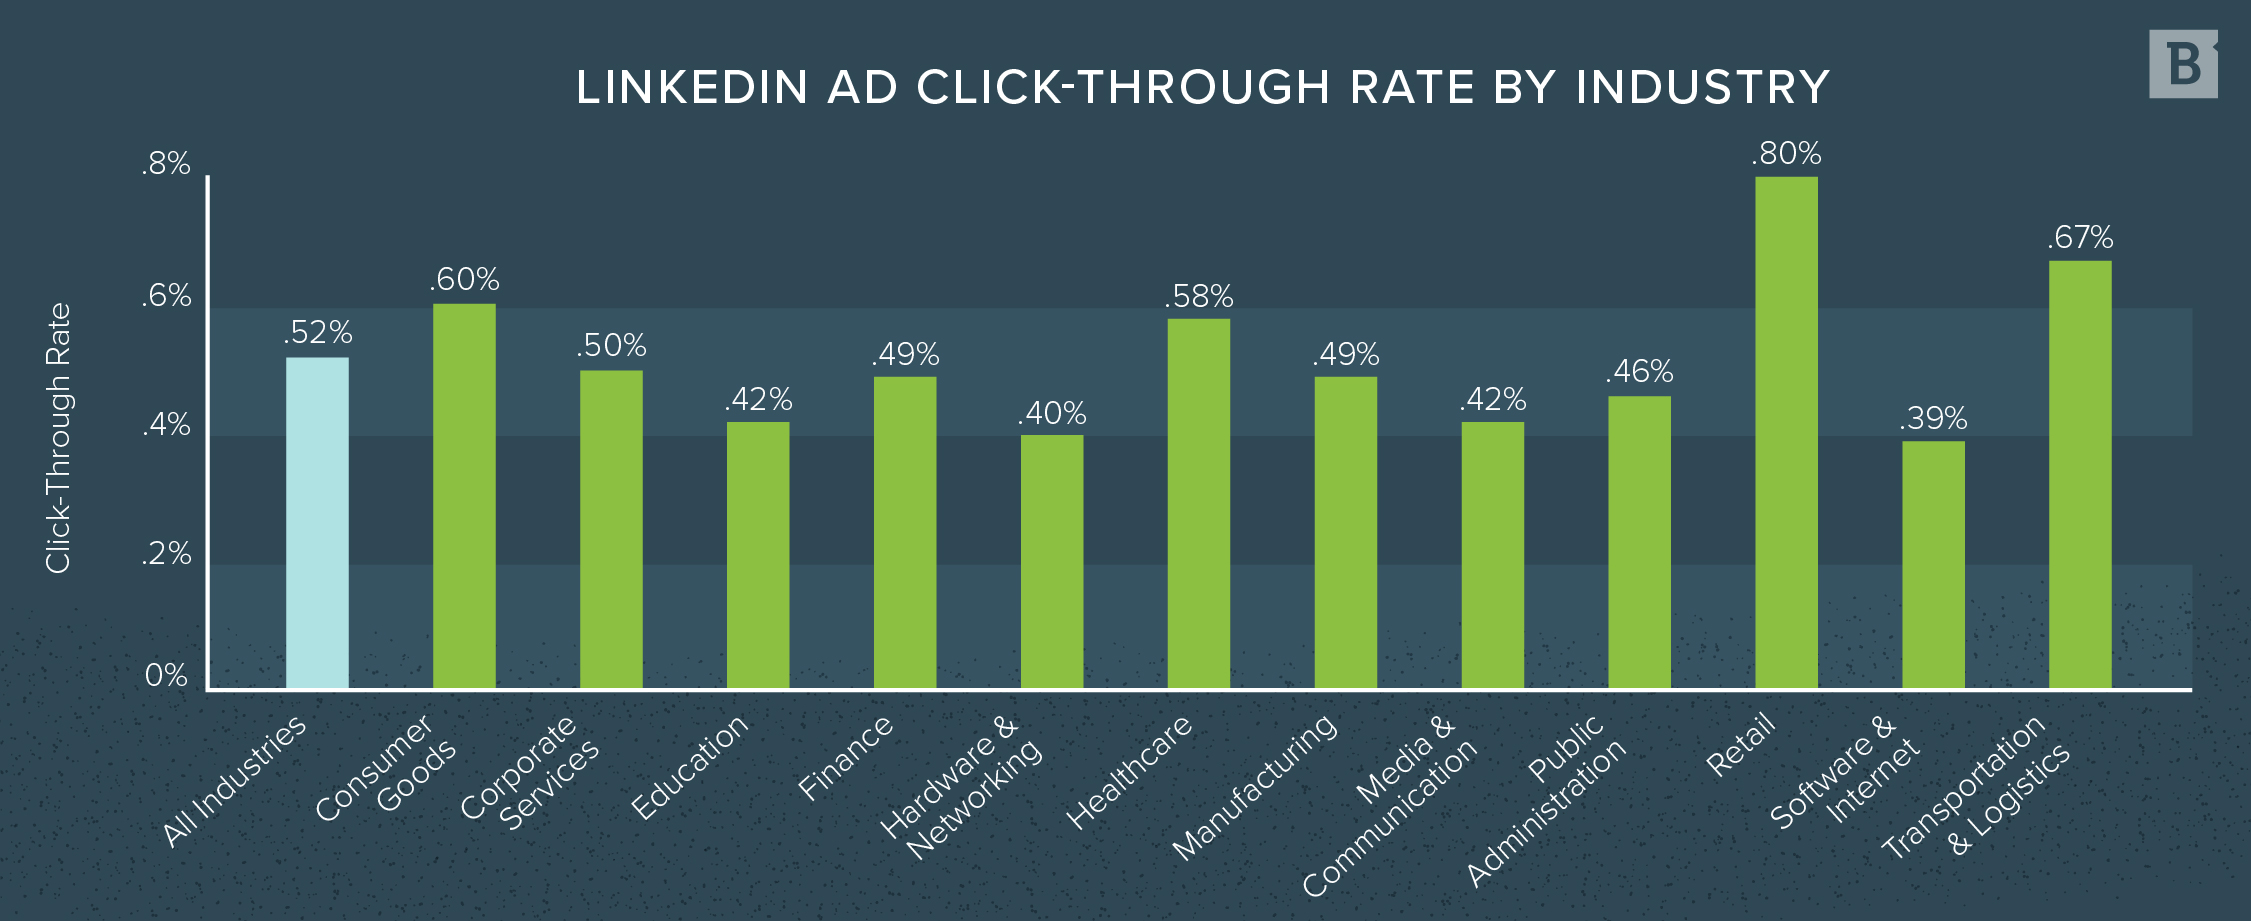
Overall, the CTR for LinkedIn ads across industries (0.52%) is lower than the CTR for Facebook ads (0.90%).
The retail segment experiences the highest click-through rate of 0.80%, followed by transportation and logistics at 0.67%. Hovering between 0.40% and 0.42% are software and technology, hardware and networking, and media and communication.
Source: The B2B House
LinkedIn Ad Cost per Lead by Industry
Cost per lead (CPL) is the average price you pay as an advertiser to capture one lead. Tracking this metric is a top priority if your advertising campaign revolves around lead generation. CPL may sound similar to cost per conversion and cost per action, but it’s specific to ads that contain LinkedIn’s Lead Gen Forms.
Here’s a simple way to calculate your CPL:
Total Ad Spend ($) ÷ Number of Leads = Cost per Lead ($)
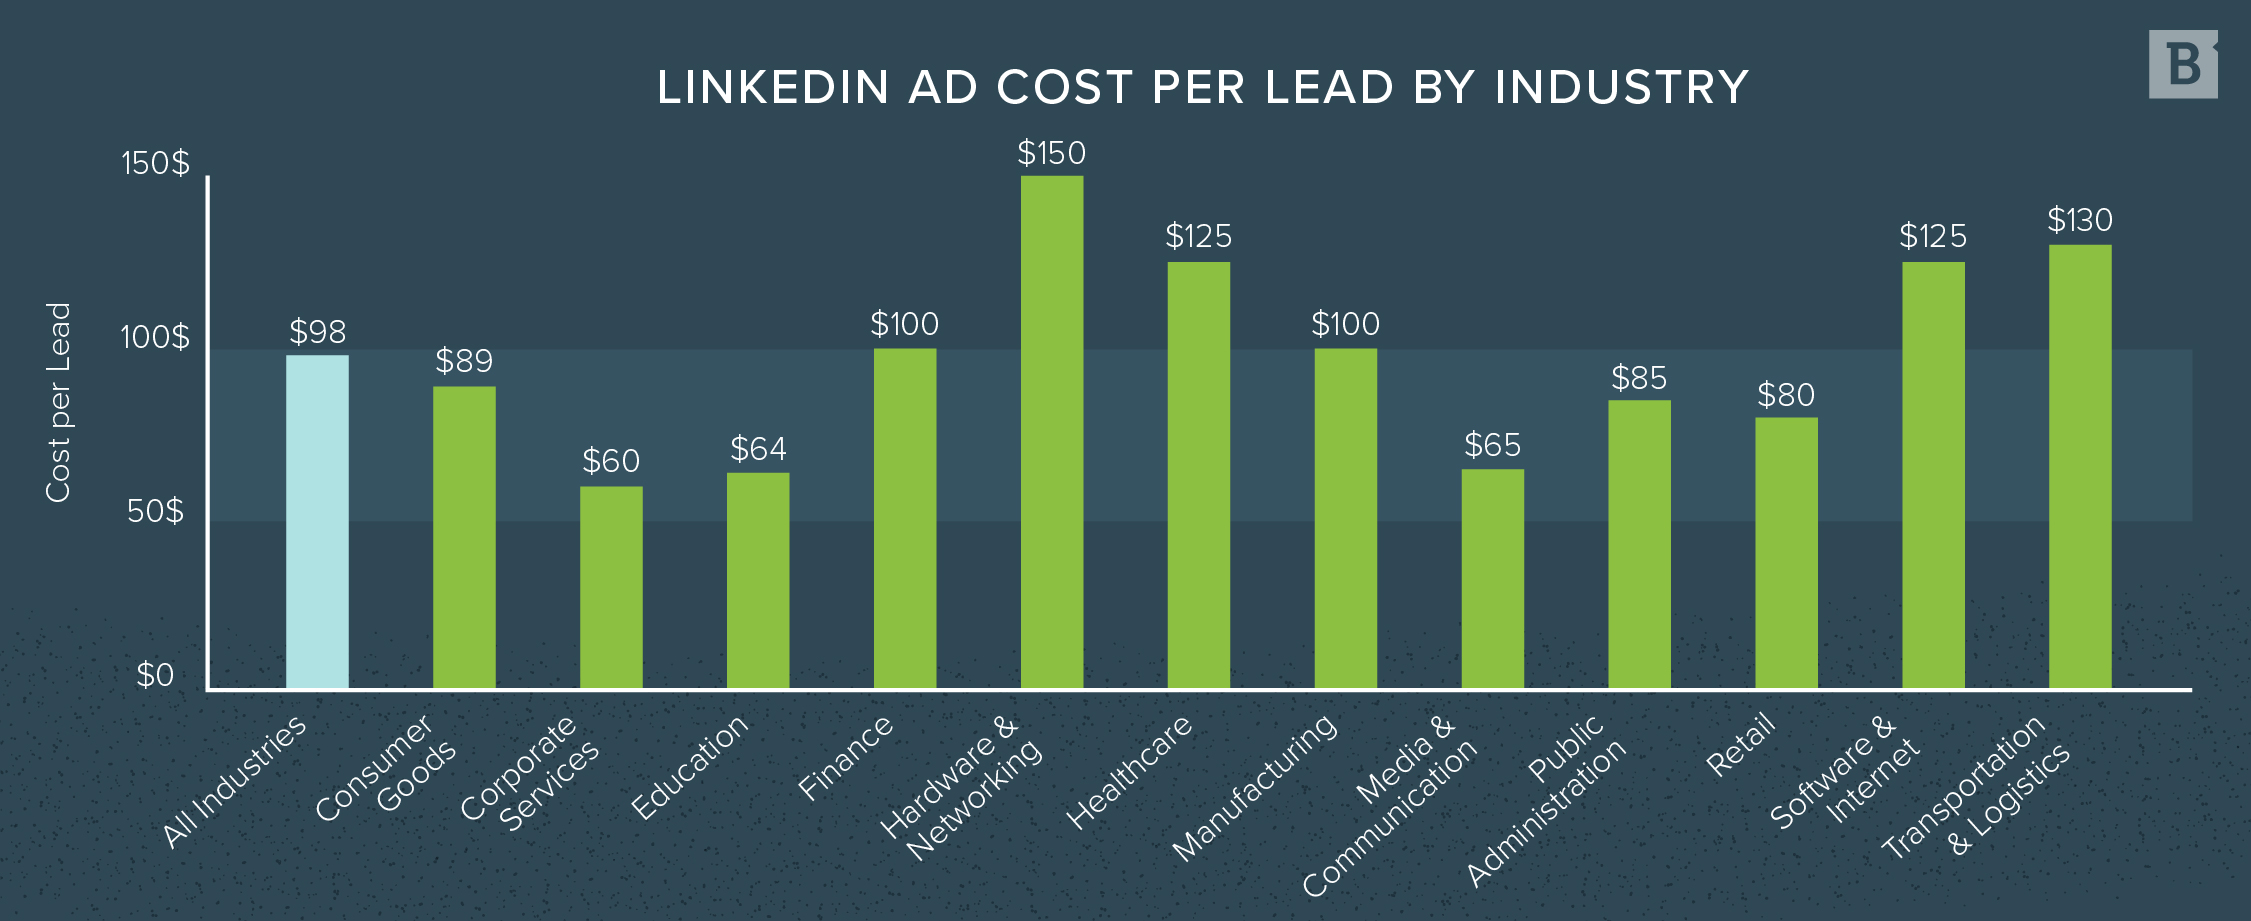
While the average CPL is $98, the benchmark swings pretty significantly from one industry to another. In hardware and networking, you can expect to pay $150 to generate one lead. But you’ll pay much less if you’re an advertiser in corporate services ($60), education ($64) or media and communication ($65).
As The B2B House points out, CPL on LinkedIn can range even more broadly from $15 to a whopping $350: “This huge variation is caused by audience type, offer, [and] creatives.” While analyzing your industry average can be a great starting point, “the best benchmark is your own historical data.”
Source: The B2B House
LinkedIn Ad Engagement Rate by Industry
Engagement includes all interactions with your ad — including clicks, likes, comments, shares and other actions, depending on your chosen ad type.
There’s an easy way to figure out how many people are actively engaging with your sponsored content out of all those who are seeing it:
Number of Interactions ÷ Number of Impressions x 100 = Ad Engagement Rate (%)
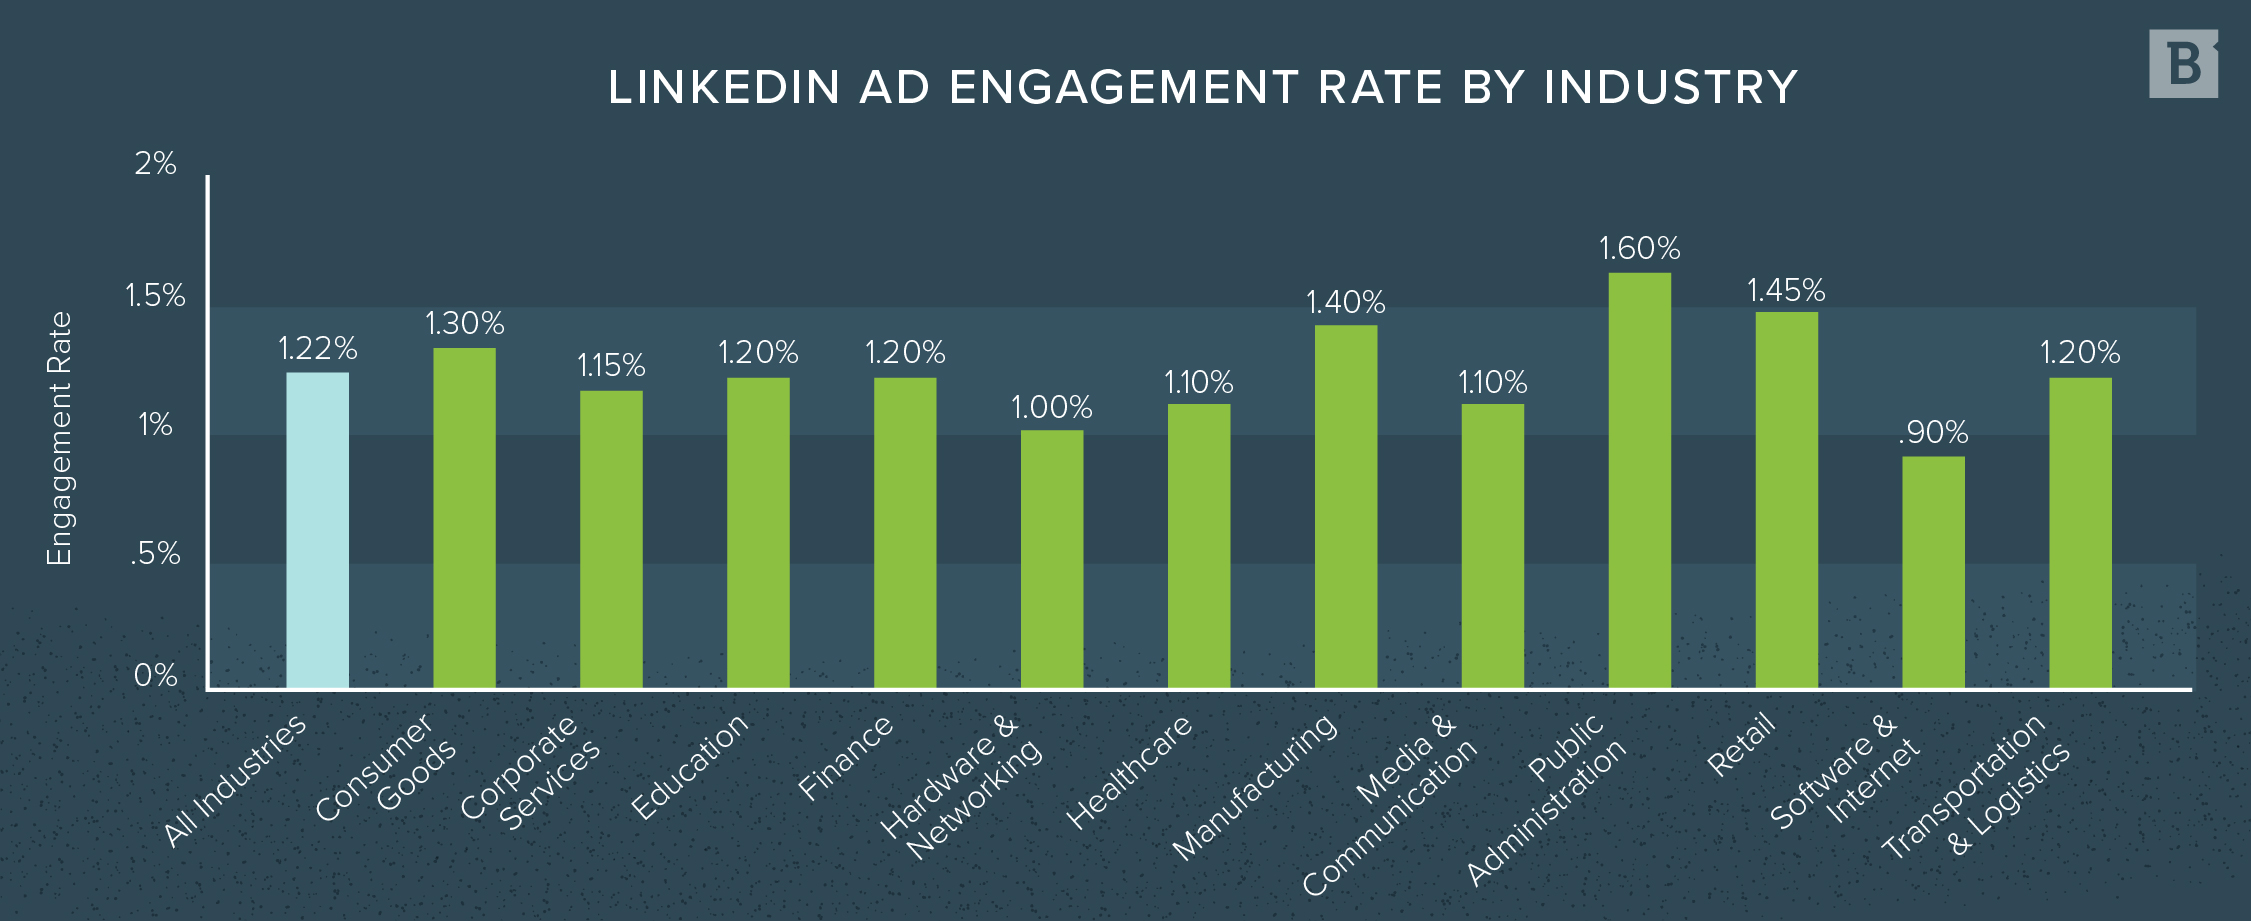
The 1.22% ad engagement rate benchmark across all industries means you’ll get about one interaction for every 82 impressions.
Most industries don’t veer all that far away from this rate, with the lowest engagement rate at 0.90% for software and internet advertisers and the highest at 1.60% for those in public administration.
Source: The B2B House
YouTube Advertising Benchmarks
YouTube is an ideal place for advertisers with compelling video content to share. And its advertising options mean you don’t need YouTuber fame or even a lot of channel subscribers to get the word out on this popular video platform.
Since people are reportedly 4 times more likely to gather information about a product, service or brand on YouTube compared to other platforms, it’s an important place to establish an advertising presence and reach high-intent consumers.
Possible YouTube ad formats include:
- Videos viewers can skip after 5 seconds.
- Non-skippable videos.
- Bumper ads (non-skippable ads lasting 6 seconds or less).
- Overlay images and text.
YouTube Ad Click-Through Rate by Industry
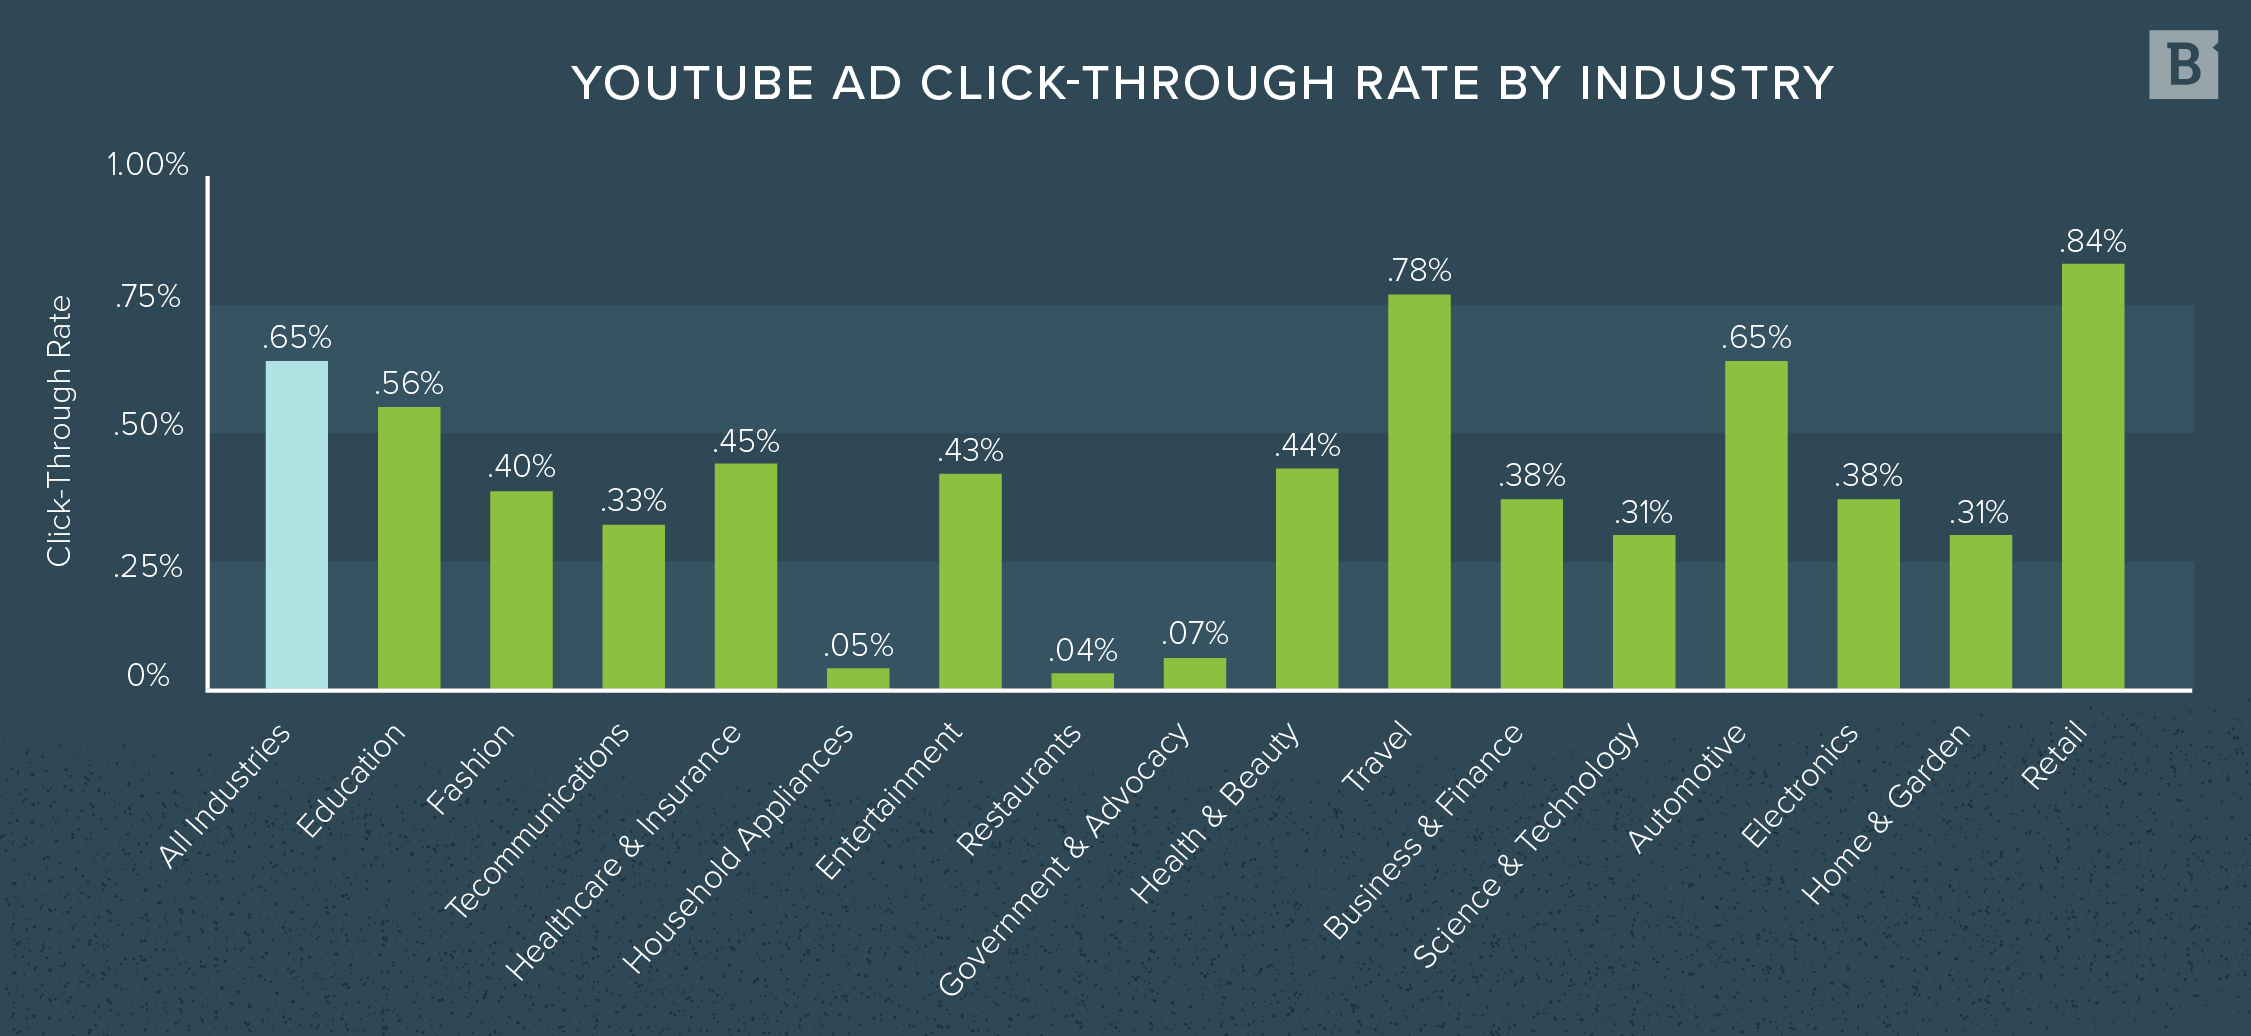
The overall CTR benchmark across industries on YouTube is 0.65%, placing it slightly higher than LinkedIn but lower than Facebook.
Several verticals experience low click-through rates, including restaurants (0.04%), household appliances (0.05%) and government and advocacy groups (0.07%). At the higher end of the spectrum, average CTRs for travel and retail hover around 0.78% and 0.84%, respectively.
Source: Store Growers
YouTube Ad Cost per View by Industry
If you’re advertising on YouTube, you know your audience is there to watch something — and they’ll likely view your ad before or while consuming that content. But what does cost per view (CPV) mean, especially when users may have the option to skip or click your ad?
According to YouTube, “a view is counted when someone watches 30 seconds of your video ad (or the duration if it’s shorter than 30 seconds) or interacts with the ad, whichever comes first.”
Although the platform will show you these advertising insights, a quick way to calculate CPV is:
Total Ad Spend ($) ÷ Number of Views = Cost per View ($)
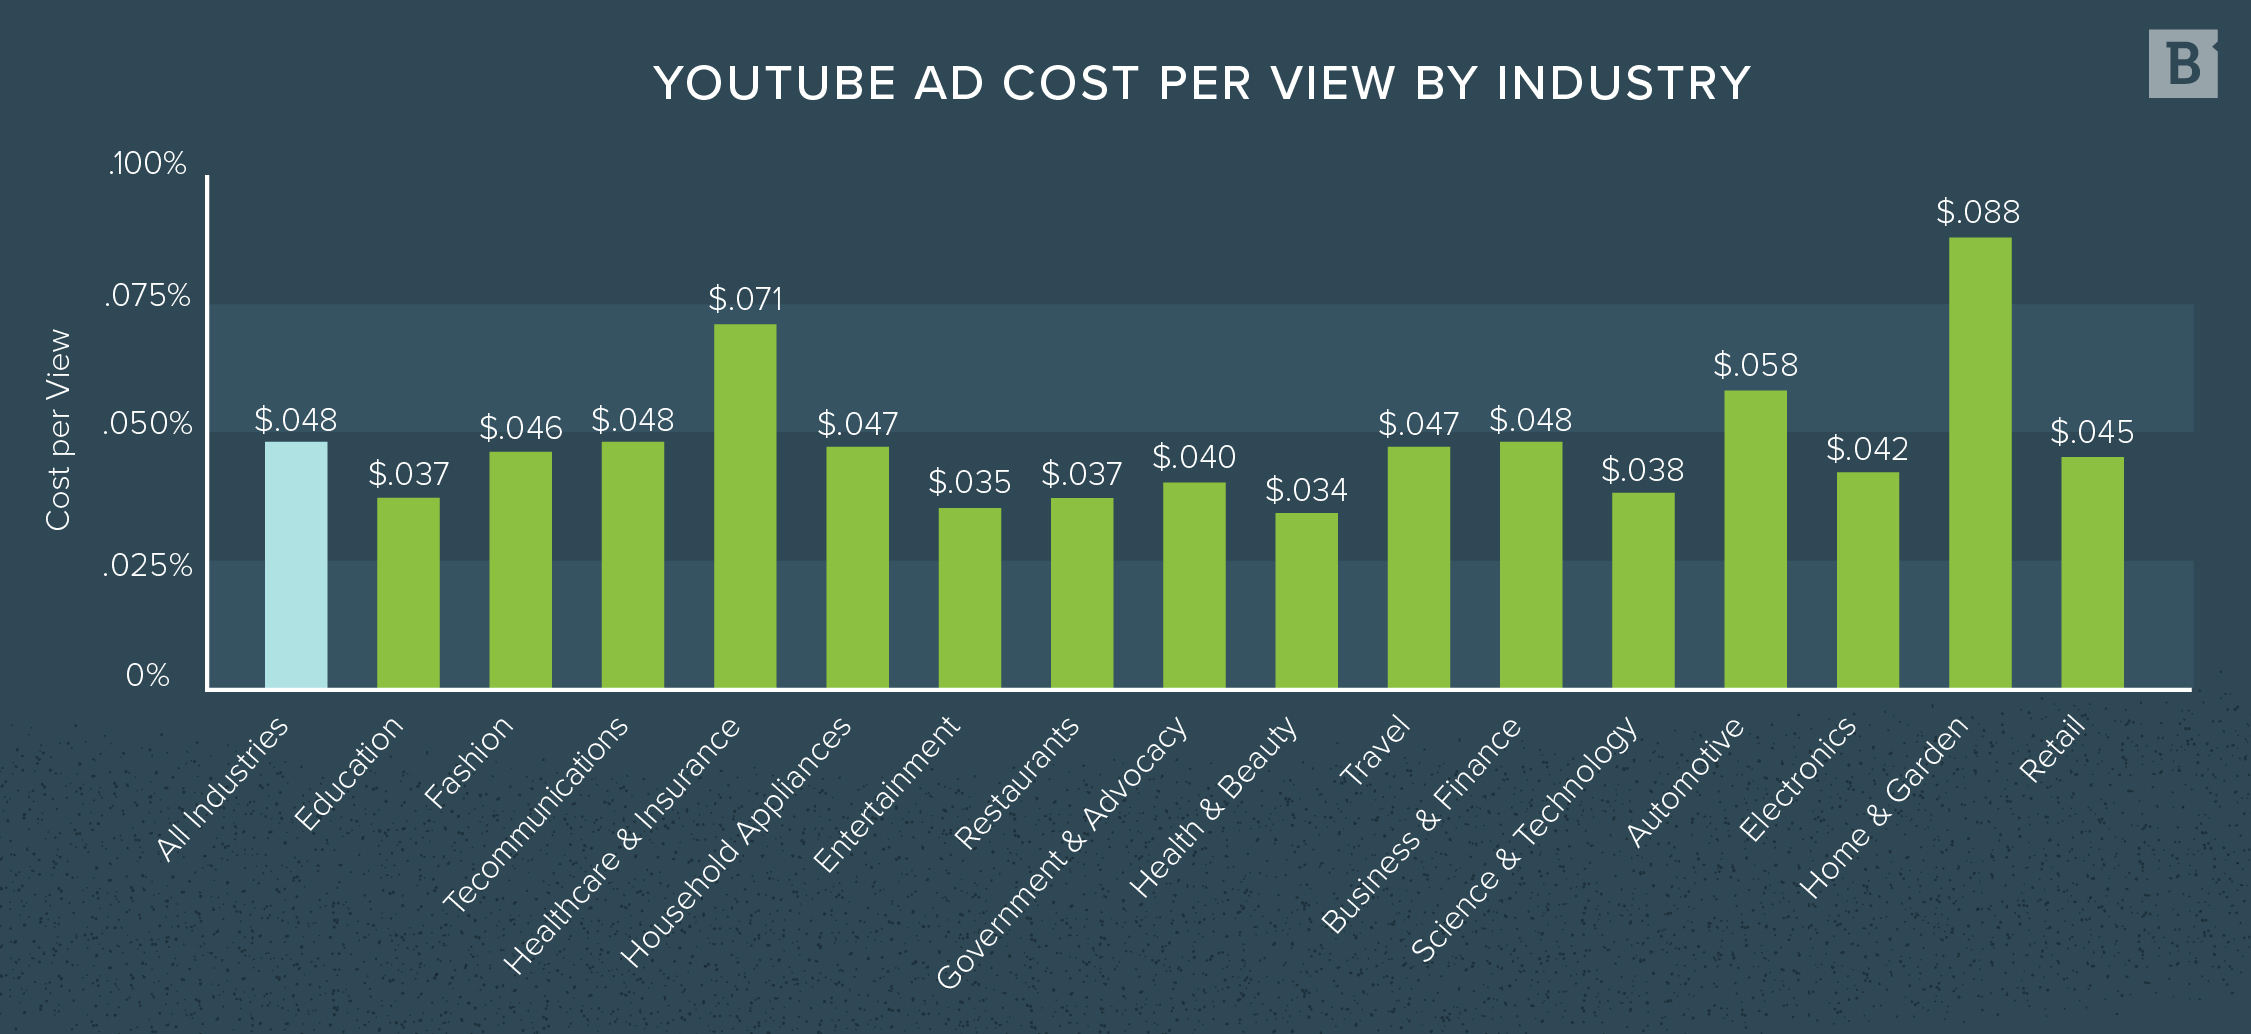
Across industries, advertisers are spending $0.048 per view on average. In other words, most advertisers end up paying at least $4,800 to accrue 100,000 views on their ad.
On the higher end, in the home and garden space, you can expect to pay around $0.088 per view. Health care and insurance companies benchmark around a CPV of $0.071.
However, as YouTube explains, “You’ll never pay more for a view than what you’ve bid, and you can make adjustments to your bidding strategy whenever you like – so you’re always in control.”
Source: Store Growers
YouTube Ad View Rate by Industry
For YouTube advertisements, view rate is defined as “the percentage of people who watched your ad when it was served to them.” What does it mean? According to YouTube, “It’s a pretty good indicator of how well your creative is working, and if you’re targeting the right people.”
Here’s how it’s determined:
Number of Views ÷ Number of Impressions * 100 = View Rate (%)
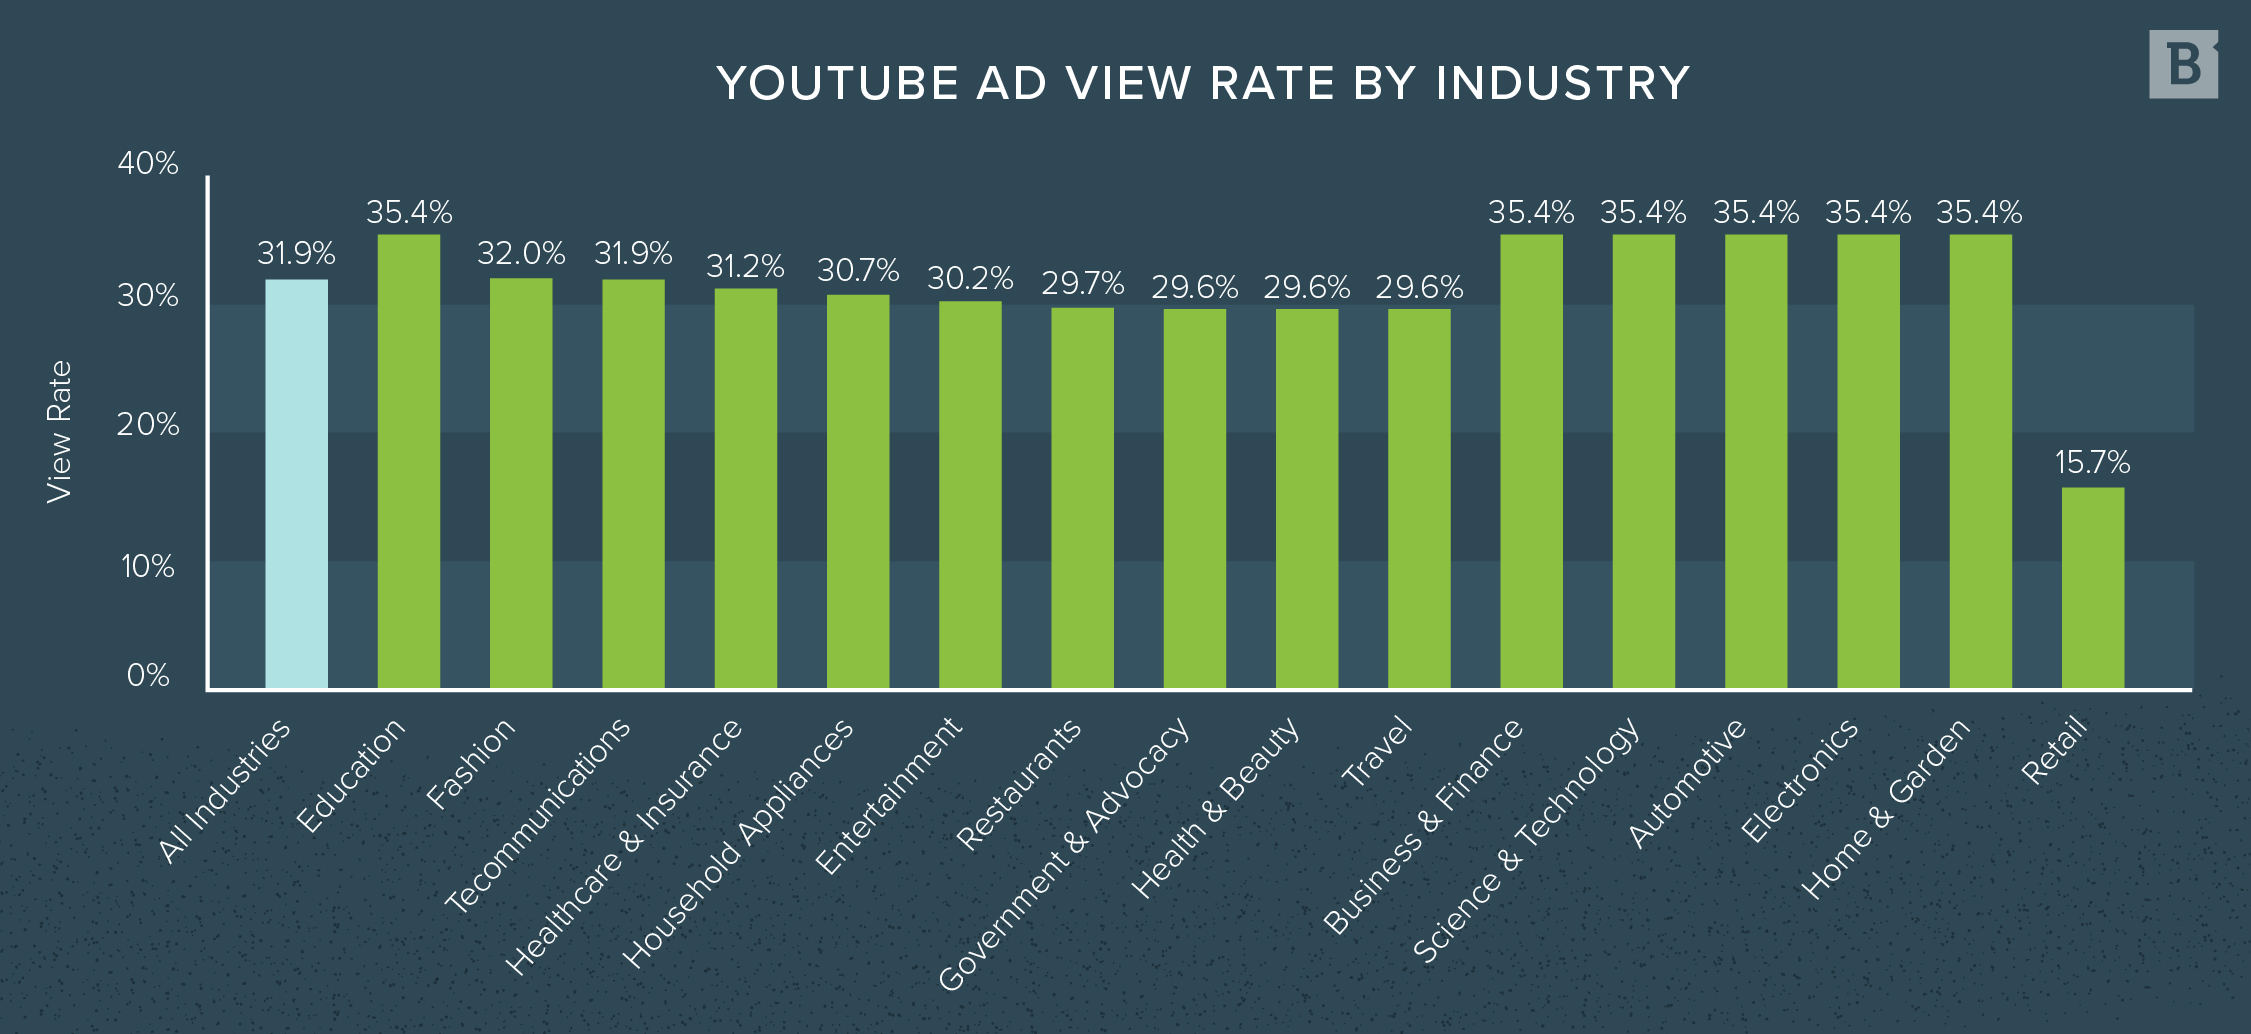
If your ad racked up 1,000 impressions and 319 people stuck around to watch or engage with it, your view rate would be 31.9%, which is right on track with the all-industry benchmark figure.
Several industries experience higher view rates over 35%, including education, business and finance, science and technology, automotive, electronics, and home and garden. Only retail advertisers see a much lower-than-average benchmark of just 15.7%.
Source: Store Growers
Instagram Advertising Benchmarks
Instagram has evolved from a neat little grid of pictures to become a video-viewing app, marketplace and more. As a result, the app offers social media advertisers a variety of options for promoting their accounts, landing pages and product listings users can buy right within the app.
Ad formats on Instagram include:
- Image posts.
- Video posts.
- Carousel posts.
- Image or video ads in Stories.
- Reels.
- Instagram Shop listings.
Despite the popularity of Instagram advertising, metrics for specific industries aren’t widely published. For now, we rounded up some key benchmarks that apply across all industries.
But if you’re looking for an at-a-glance understanding of Instagram ad performance in your field, check out these reports by Social Bakers where some helpful data is visualized for a range of industries, including:
- Airlines.
- Automotive.
- Beauty.
- E-commerce.
- Electronics.
- Fashion.
- Finance.
- Media.
- Telecommunications.
- Retail.
Instagram Ad Click-Through Rate
Users engage differently with sponsored content that appears in the main feed — like image posts and carousels — and ads that show up between Stories.
In general, Instagram feed ads see CTRs between 0.22% and 0.88%, whereas Stories ads experience a narrower CTR range of 0.33% to 0.54%. These ranges skew lower than the other platforms we’ve looked at so far.

Sources: Adstage, Smart Insights
Instagram Ad Cost per Click
Although the $1.83 CPC benchmark for Instagram Stories ads falls quite close to Facebook’s $1.86 CPC across industries, the cost per click on feed ads is just shy of double that rate, at $3.35.

Source: Adstage
Instagram Ad Cost per Mille
Cost per mille (CPM) is the price an advertiser pays for 1,000 impressions — with “mille” coming from the Latin word for “thousand.” Here’s how to calculate it:
Total Ad Spend ($) ÷ Number of Impressions * 1,000 = Cost per Mille
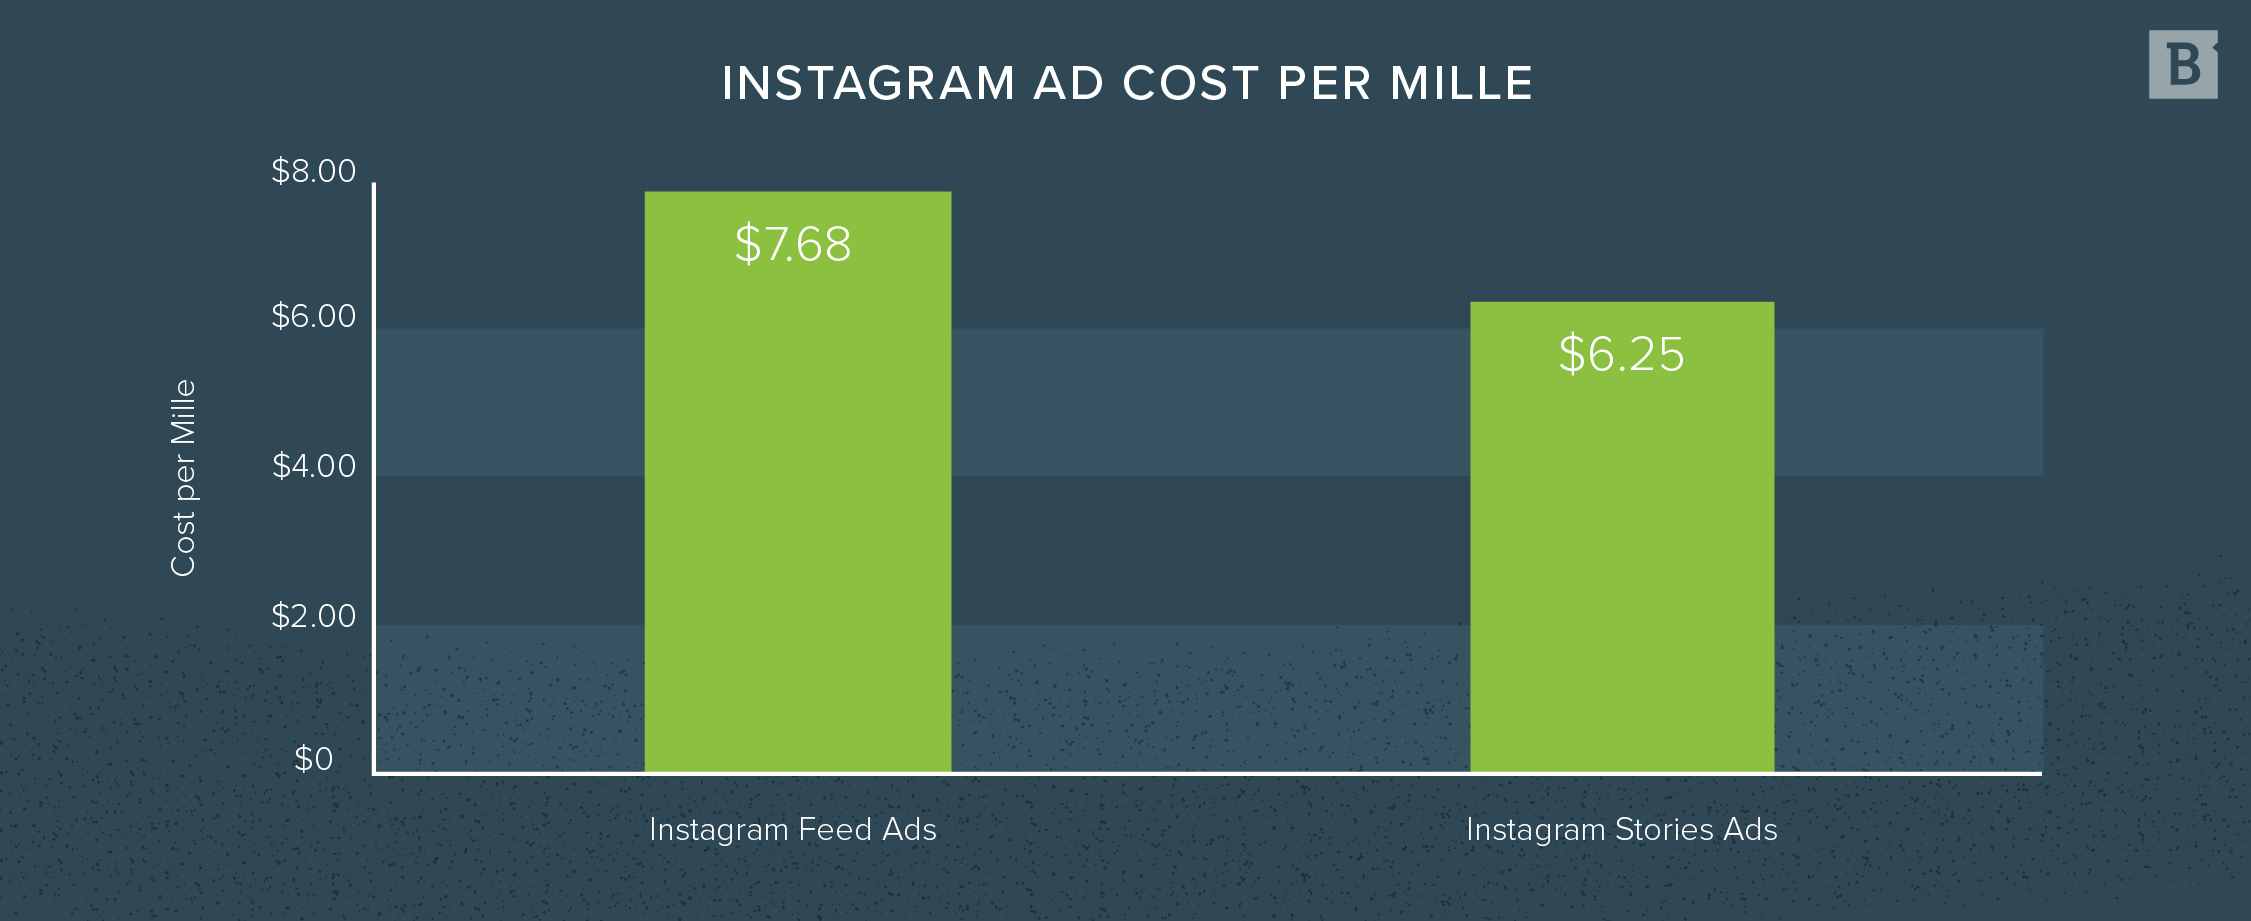
CPM can be a more useful metric than cost per impression, which is often a minuscule amount like $0.00768. Multiply that by 1,000 and suddenly you get $7.68, a figure you can wrap your head around. That’s the average CPM benchmark for Instagram feed ads.
For Stories ads, the benchmark sits a little lower at $6.25 per 1,000 impressions.
Source: Adstage
Twitter Advertising Benchmarks
Whether your target audience turns to Twitter for clever celebrity missives or breaking news, advertising on the platform is a great way to reach a highly engaged audience with quick snippets of sponsored content.
Twitter offers a variety of ad formats, including:
- Text posts.
- Images.
- Videos.
- Carousels.
- Collections of Tweets known as Moments.
- Promoted accounts.
Plus, the platform offers advertisers the ability to sponsor content across other formats like:
- Twitter Amplify.
- Twitter Takeover.
- Twitter Live.
As with Instagram, we didn’t have access to industry-specific benchmarks for Twitter advertising. But the following all-industry averages should give you a good idea of where your ad performance stands.
Twitter Ad Click-Through Rate
Across industries, the 0.86% average CTR for Twitter ads is higher than the benchmarks for LinkedIn and YouTube ads. It’s also right at the top end of the range for Instagram feed ads, but just 4 percentage points shy of Facebook’s all-industry average.

Source: Adstage
Twitter Cost per Click
Universal CPC benchmark for Twitter ads is significantly lower compared to Instagram, and it’s also less than the all-industry average cost per click on Facebook. No matter what industry you’re in, it seems that Twitter is a more affordable option or entry point for social media advertisers.

Source: Adstage
Twitter Cost per Mille
Once again, Twitter offers a lower CPM than Instagram, with advertisers across industries spending $5.00 on average to generate 1,000 impressions per ad.

Source: Adstage
Conclusion
While these social advertising benchmarks based on industry and platform are helpful starting points, your most valuable benchmarks come from your past performance metrics. Need help parsing through the data? Want an in-depth audit of your social media advertising or a strategy overhaul? Our social media team is here to help.
Editor’s Note: Updated February 2023.


